
http://www.cdc.gov/mmwr/preview/mmwrhtml/mm5651a7.htm
I was curious about the way this compares with earlier years. I only included the data from each year that ended in a zero.

Section 6 – Life Tables
Page 19
Table 6-5. Estimated Average Length of Life in Years, by Race and Sex: Death-Registration States, 1900-28, and United States, 1929-93
Free Full Text PDF from CDC page 25/28 in the PDF page counter
As you can see, the slope (you remember that term from math) of the increase changes at about 1950. This does not mean that anything bad was happening in 1950. Maybe all of the dramatic increases had already been made.
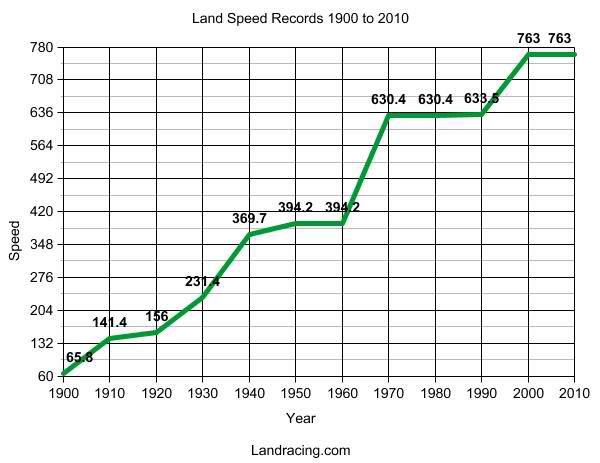
For comparison I decided to look at the land speed records from 1900 to 2010.
Why land speed records?
It was the first thing that popped into my head when I thought about something that would have improvements well documented over time. I used the highest speed recorded at the end of each year that ended in a zero.
There were actually a bunch of records in 1899 – from 39.3 to 69.8. There was no new record in 1900, so I included the record that everyone was trying to beat. You can see that there are some flat spots on the chart. That means that no new record had been set since the last record.
All Out Land Speed Record List
Do the flat parts of this chart indicate that no progress was being made? No.
One difference is that this is a chart of the fastest speed up until that time, so it will never go down.
The life expectancy chart will go whichever way the average life expectancy goes.
During this time – 1900 to 2007 – life expectancy has continually increased.
There has never been a decrease.
The fastest speed recorded in any year has often been less than the land speed record. Yet both show dramatic increases.
Just more evidence that there is no such thing as The Good Old Days.
This continual improvement has come about by rejecting tradition.
–
Updated 19:15 9-16-10 – I added a title (I changed the link to match the title, too) and links for the chart information.
The first chart is from the CDC. The others were created with data from the locations linked.
I was rushing out the door and “oopsy.”
.


[…] Medic shines a spotlight on the magic of Continually Improving Life Expectancy. I agree with Rogue in that the one problem I see with that whole bit is that even though life […]