Does EMS provide any benefit to patients by starting an IV (IntraVenous) line?[1]
I think that it helps to start by looking at some of the results. The distribution of the vital signs gives us a bit of information about the patients receiving EMS IVs.
–
–
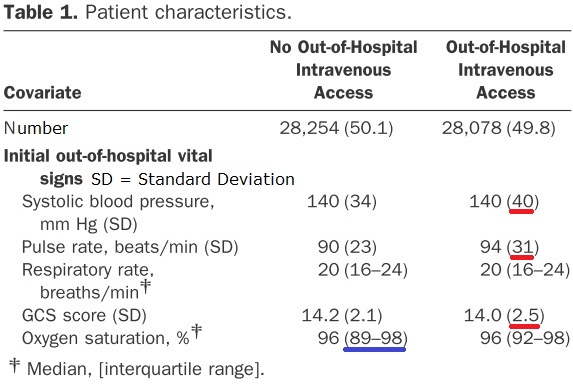
The numbers appear to be mean averages, except where noted to be median. The red lines are under the SD (Standard Deviation) for each vital sign with the wider SD. All of these are in the IV group. The overall numbers are almost identical. Usually a wider SD indicates a smaller sample, which suggests less reliability of the data. This sample is large and split close to 50/50 IV vs. No IV. The wider SDs indicate that the vital signs are much more diverse in the IV group. To look at it from the other perspective, the No IV group has much more stable looking vital signs.
For blood pressure, the mean is 140 for both. The SD ranges from 106 to 176 for one SD of the No IV group, but from 100 to 180 for the IV group.
For pulse, the mean is 90 for the No IV group and 94 for the IV group. The SD ranges from 67 to 113 for one SD of the No IV group, but from 63 to 125 for the IV group. The mean pulse is higher and the SD is wider, resulting in a pulse that is only 4 beats lower at the low end of the SD, but 12 beats higher at the upper end.
For the GCS (Glasgow Coma Score[2]), the mean is 14.2 for the No IV group and 14.0 for the IV group. The SD ranges from 12.1 to 15 (upper limit of measurement) for one SD of the No IV group, but from 11.5 to 15 for the IV group. The mean GCS is lower and the SD is wider, resulting in a GCS that is the same at the high end of the SD (it cannot go any higher), but 0.6 points lower at the lower end. Since GCS is not measured in fractions, that means that about two thirds of the IV patients were a full point lower than the No IV group, on average for those with the most normal GCS. One standard deviation around the mean average is the most normal group of patients.
As the numbers become less normal, we should expect that the differences between the groups will increase, rather than decrease, unless there is something affecting the distribution that has not been accounted for. There is no guarantee of this. With the GCS, 15 is the highest number that can be recorded, so the GCS numbers will not continue to deviate in that direction, but the number of patients with a GCS of 15 will probably be what changes.
If we want to look at this from the perspective of those not receiving EMS IVs, we only need to flip the results. More of the vital signs in the No IV group will appear to be stable, while in the IV group, more will appear to be unstable. This will become more important to consider when looking at the outcome that matters – mortality, or to flip that around – survival.
–

Another place where we can see some dramatic differences between the groups. The difference in the presumed disease by whether an IV was started.
The biggest difference is in the patients with the potential cardiovascular complaints. Almost three times as many received IVs as did not. The only other category that had a higher percentage receiving IVs than not receiving IVs was the metabolic/endocrine group.
After cardiovascular, the next largest medical condition is respiratory, but these are about one and a half times as likely to have No IV. Why? I think a lot of this has to do with two different conditions. Asthma often responds to a nebulized treatment, so an IV may not be seen as important outside of the hospital. The other respiratory condition may be anxiety-induced hyperventilation.
There does appear to be discrimination among patients according to medical condition. The question is whether this discrimination is beneficial to the patients.
–
One look at the outcomes produces a mixed picture.

The length of stay is the same, but the IQR (InterQuartile Range) is shorter for the IV group – 1-4 vs. 2-5. It would be interesting to see the distribution, because this suggests that a graph of one group is not just a bit more/less than the other, but that the pattern of distribution looks different.
Mechanical ventilation is 3% with IV vs. 2% without IV. The need for ICU admission is 18% with IV vs. 8% without IV.
In spite of this, the in-hospital mortality is 3% each and the 28 day survival is 4% each.
–
In Part II, I will look at the probable explanation for this.
–
Footnotes:
–
[1] Intravenous Access During Out-of-Hospital Emergency Care of Noninjured Patients: A Population-Based Outcome Study.
Seymour CW, Cooke CR, Hebert PL, Rea TD.
Ann Emerg Med. 2011 Aug 26. [Epub ahead of print]
PMID: 21872970 [PubMed – as supplied by publisher]
–
[2] Glasgow Coma Scale
Wikipedia
Article
.


Subscribe to RogueMedic.com